
Here we present a summary of the method developed and applied in the Fire Scars Mapping of Brazil (1985 - 2022) collection 2.
For more methodological details, access the ATBD in this LINK.
GENERAL CHARACTERISTICS
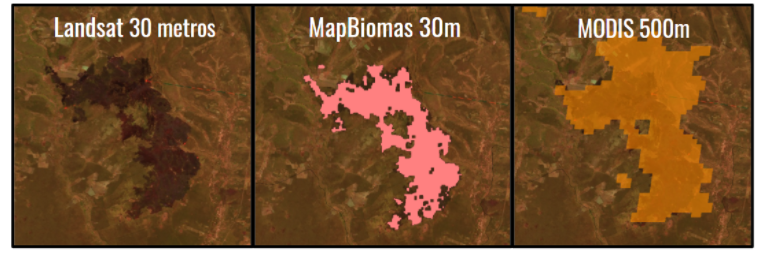
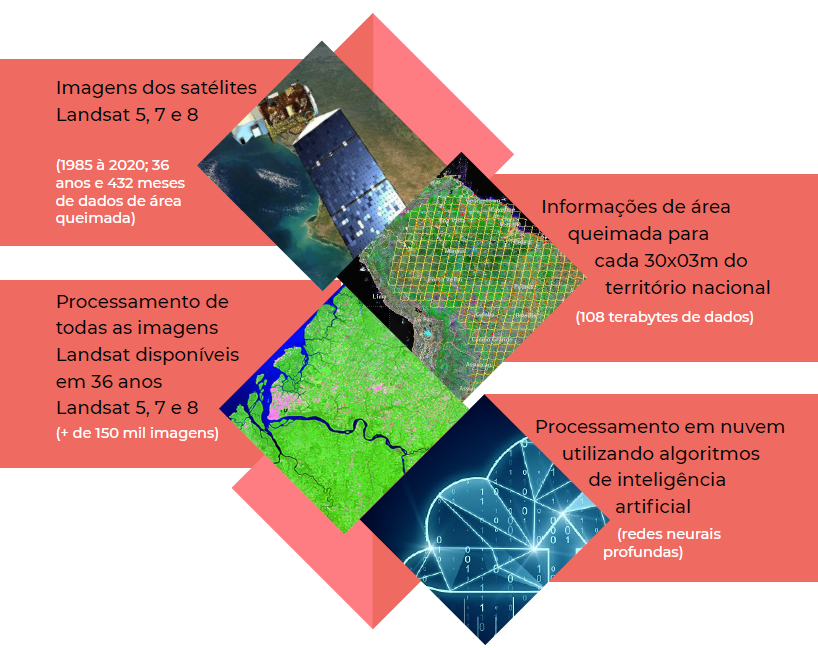
All fire scar mapping of Brazil was based in Landsat satellite image mosaics with 30 meters spatial resolution. The mapping period was from 1985 to 2022, with monthly and annual data of fire scars covering the whole Brazilian territory.
The entire process was done collaboratively among institutions of the MapBiomas' project and with artificial intelligence through the use of machine learning algorithms on the Google Earth Engine plataform and Google Cloud Storage, which offer immense processing capacity in the cloud.deep learning) na plataforma Google Earth Engine e Google Cloud Storage que oferecem imensa capacidade de processamento em nuvem.
The work was organized by biomes and regions, with sample collection in burned and unburned areas for algorithm training by regions, in addition to the use of reference maps, such as burned areas from the MODIS product (MCD64A1 - https://lpdaac.usgs.gov/products/mcd64a1v006/) of 500 m spatial resolution and data from INPE (https://queimadas.dgi.inpe.br/).
2. METHOD OVERVIEW
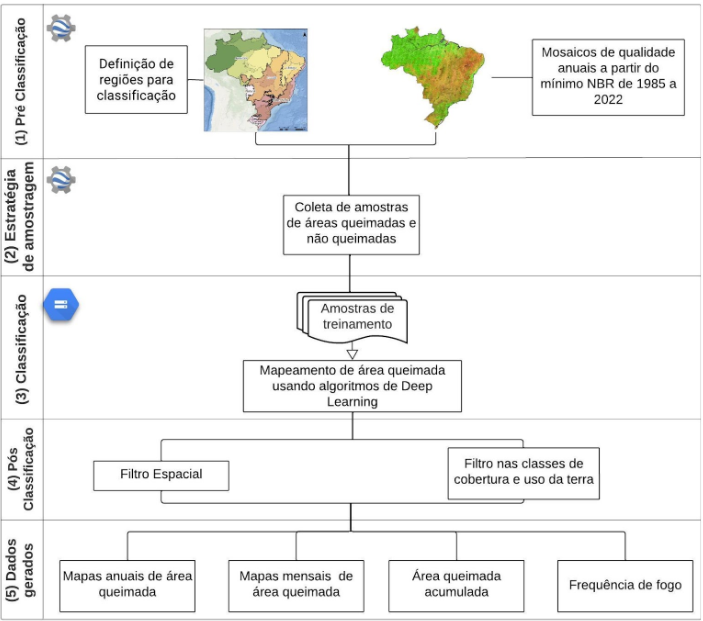
The first stage consists of defining the regions per biome for classification. The second stage consists of building annual mosaics for classification, and the third stage is to collect training samples of burned and unburned areas in the Landsat image mosaics on the Google Earth Engine platform. For the classification step the Google Cloud Storage Bucket platform was used, where the mosaics for classification and the training samples were stored, in addition to the use of virtual machines for processing the classification algorithms.
The diagram below illustrates the main steps and platforms used in the classification process of fire scars in Brazil.
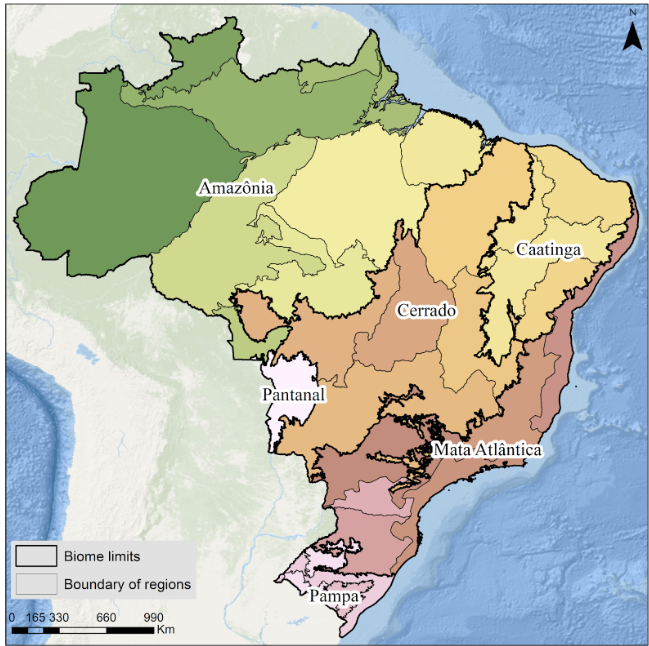
2.1. DEFINITION OF REGIONS BY BIOME
For each biome, regions were defined for training sample collection and classification of burned areas by region, with the goal of obtaining a more accurate classification based on soil and climate factors and regional vegetation. The following regions were defined for each biome:
2.2. ANNUAL MOSAICS
Classification was performed using mosaics of images from Landsat Surface Reflectance satellites (SR) USGS Landsat Collection 2 (Tier 1) (30m × 30 m) constructed for each of the years 1985 to 2022. All available scenes from Landsat 5 (1985 t0 2011), Landsat 7 (1999 - 2012) and Landsat 8 (2013 - 2022) were used, all with a 16-day interval.
2.3. SAMPLE COLLECTION
This step consists of collecting training sample polygons of burned and unburned areas in the annual Landsat mosaics for each biome region and sensor (Landsat 05/Landsat 07 and Landsat 08).
Thus, we obtained a sample set per sensor and for the 28 regions of Brazil, to be used for training the classification model.
2.4. CLASSIFICATION
The classification model used was the Deep Neural Network, which consists of computer models based on mathematical calculations capable of machine learning and visual pattern recognition.
The burnt area mapping algorithm consisted of two phases: training and prediction. Based on the training samples of burned and unburned areas, the following spectral bands were used as input for the burned area classification model: red (RED - 0.65 µm), near infrared (NIR - 0.86 µm) and shortwave infrared (SWIR 1 - 1.6 µm and SWIR 2 - 2.2 µm). These Landsat spectral bands were chosen based on their sensitivity to fire events. The training data input was split into two sets: 70% of the samples used for training and 30% for testing.
2.5. POST-CLASSIFICATION
After training and testing the model, the classification was applied with biweekly Landsat images for the entire analysis period (1985 to 2022). A spatial filter was applied to remove noise and fill small empty gaps: areas smaller or equal to 1.4 hectares (16 pixels) were removed, and empty gaps smaller or equal to 5.8 ha (64 pixels) were filled as burned areas.
After evaluation of the classification results, post classification filters were also applied removing pixels that were in the following land cover and land use classes from MapBiomas Collection 7 in the biomes:
- Caatinga: Water and Rocky Outcrop;
- Cerrado: Water and Urbanized Area;
- Atlantic Forest: Water, Urbanized Area, Rice, Mining, Soybean, Temporary Crop, Sugar Cane and Others Temporary Crops.
- Pampa: Rice, Soybeans, Other Temporary Crops, Mosaic of uses, Urbanized Area and Water;
- Pantanal: Water, Soybean, and Other Temporary Crops;
To obtain the information of the month in which the fire scar was mapped, postclassification processing was performed to retrieve the information of the date of the pixel that was burned from the date of the pixel in which the annual mosaic was constructed from the minimum NBR.
2.6. RATING ASSESSMENT
Burn scar classification evaluations were performed with monthly Landsat images, with visual inspection, statistics, and relationship with lMapBiomas land use and land cover data, as well as comparison with reference maps (MapBioms Fire Collection 1, MODIS, INPE, GABAM, FIRMS, FireCCi, hotspots).