

WATER SURFACE MAPPING : METHOD SUMMARY
Here we present a summary of the MapBiomas Water Method. Access the ATBD (Algorithm Theoretical Basis Document ) in this LINK. for more methodological details.
- Presentation
MapBiomas Water aims to provide monthly and annual data about the dynamic of water surface and water body from the entire national territory since 1985 and to discriminate against anthropic and natural water bodies (small and large dams and water in mining areas). Also, the water surface mapping will provide more details about the annual map of use and cover of the land of the Brazilian biomes, adding information on the occurrence of wetlands and more detail about small bodies of water (i.e. > 0.5 ha).
Brazil’s water surface mapping used all Landsat satellite scenes with up to 70% cloud cover, at the spatial resolution of 30 meters. Mapping was conducted at a sub-pixel scale with a spectral mixing model (MEM) and empirical classification rules based on fuzzy logic. The mapping included the period from 1985 to 2022 on a monthly scale, with more than 190,000 Landsat scenes processed and analyzed on the Google Earth Engine platform.
- Organization and Database
Imazon and WWF-Brasil do the general coordination of MapBiomas Water, and Geokartan does the technical and operational coordination. The reconstruction of the monthly water surface series was conducted by experts from all Brazilian biomes, with the leadership of the following institutions: Imazon (Amazon and Pantanal biome), Geodatin (Caatinga), Solved (Atlantic Forest), Geokarten (Pampa) and IPAM (Cerrado). We also have valuable inputs for mapping and validating ArcPlan results (Pantanal and Atlantic Forest). The water surface and water bodies mapping algorithm was originally developed by Imazon, and perfected in this first stage of MapBiomas Água work.
The MapBiomas Water control panel development (dashboard) was conducted by Geodatin and had the relevant contribution of the MapBiomas Water workgroup and the platform users in the design thinking process.
MapBiomas Water developed four types of products:
1) Monthly and annual water surface maps;
2) Maps of water surface transitions between “Water” and “Non-Water” classes. This product was processed based on annual water surface data;
3) Trend maps (increase and decrease) of water surface. This product was calculated from monthly water surface data in 5 km x 5 km grids;
4) Maps of types of water bodies: natural, anthropic, hydroelectric, and mining.
The dashboard dashboard (https://plataforma.brasil.mapbiomas.org/agua) comprised maps, statistics, and tools for visualization, analysis, and data access. The data can be seen in annual and monthly scales, as well as obtaining 17 different territorial cuts, including the reservoirs from the National Water Agency (ANA – Agência Nacional de Águas). Finally, the dashboard provides a link to access the MapBiomas Water data API.
- Method
The diagram below illustrates the main steps in classifying surface water and water bodies in Brazil (Figure 1).
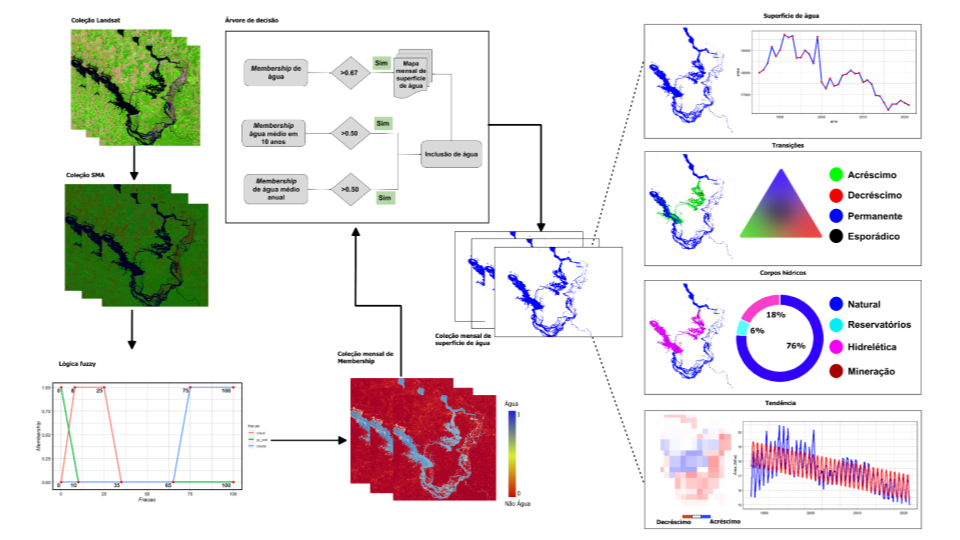
Figure 1. Classification steps of the water surface and water bodies.
Description of classification steps:
1. 1. Pre-processing : Consists in the selection of Landsat scenes from the sensors: Landsat 5 Thematic Mapper (TM), Landsat 7 Enhanced Thematic Mapper Plus (ETM+), and Landsat 8 Operational Land Imager (OLI); applying cloud and shadow masking to each scene and excluding scenes with more than 70% cloud cover. The visible, near and mid-infrared spectral bands were selected for the application of the Mixture Spectral Model (MEM). The result of the MEM is a set of compositional bands for each pixel of the Landsat image, for the Vegetation, Non-Photosynthetically Active Vegetation (NPV), Soil, Shade, and Cloud components. Water behaves as a dark body (i.e. low reflectance) in Landsat images and therefore has a high percentage of the Shadow component in the pixel. The edges of lakes, rivers, and humid environments, such as floodplains, present a mixture of Shadow (water), Vegetation, and Soil, which allows the detection of water in environments with these types of materials.
2. Water Surface Classification: It’s based on MEM compositional bands and fuzzy decision rules to obtain association maps (Water Membership) of water occurrence in the Landsat pixel. The monthly maps were obtained by combining the Water Membership values for i) a given month (detection) where pixels with a value > 0.67 are considered water; ii) the decennial of the month under analysis and the average of the year (inclusion) where pixels with a value > 0.5 are considered water; iii) the average of the year (exclusion) pixels with values < 0.35. Figure 2 illustrates the monthly ranking process.
Figure 2. Example of detection, inclusion and exclusion of information applied to mapping monthly surface water.
3. Water body classification: Information extracted from the monthly mapping of surface water was used to classify the water bodies, such as: (i) the first and last occurrence of a water body in the year, ii) the total frequency of the water surface (in the historical series) and iii) the annual frequency. This information was organized into matrix data and used in an object segmentation algorithm. The next step was to extract attributes from auxiliary maps of dams from the National Water Agency (ANA) and Mining Agency database (source: MapBiomas Collection 6 – Mining, MapBiomas Coleção 6 - Mineração). The segments of water bodies were classified with the random forest algorithm into the following classes: Natural, Hydroelectric, Man-made (small dams, fish farming, among others), and Mining Water. We have also included the class "False positives" as a product of the classification of water surface segments. This information was used to remove the false positive cases in the monthly and annual water surface maps.
4. Mapping Accuracy Analysis: The accuracy analysis of annual water classification data was conducted using MapBiomas Use and Coverage data collected by LAPIG/UFG as a reference (also on an annual scale). The class “River, Lake or Ocean” was considered as a water surface. The sample stratification method based on annual water frequency classes and distance from the next body of water was applied to reduce the sampling error of the producer's accuracy. The water frequency and distance classes used were:
- - Permanent: appears more than 90% on the annual map and at least one time in the last three years;
- - Intermittent: appears between 50% and 89% of frequency on the annual map;
- - Infrequent: appears between 10% and 49% of frequency on the annual map;
- - Soil: less than 10% of frequency appears in the time series (1985-2022);
- - 250 meters away from the nearest water body;
- - 500 meters away from the nearest water body;
- - 5.000 meters away from the nearest water body;
The total number of samples per biome, obtained by the sample design described above, is represented in Table 1, and the distribution of samples per stratum is in Table 2.
Table 1. Number of samples (points) per biome.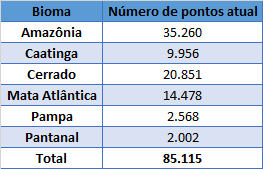
Table 2. Area (km²) of each stratum in each biome.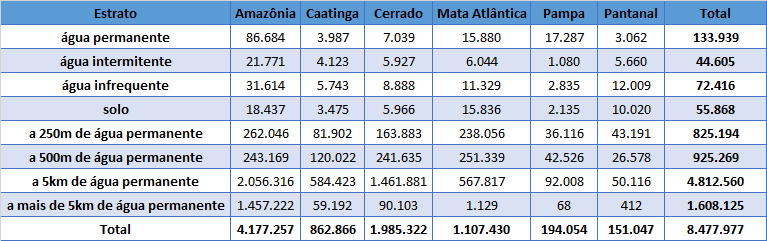
The accuracy of the user and producer (Figure 3) is generally above 75% for the annual mapping of the water surface and can reach up to 90% in some years. The exceptions were the Caatinga since 2010, the Atlantic Forest at the beginning of the time series, and mostly Pantanal, in which the user accuracy was below 50% for all the series. These results are preliminary because the data reference used in this analysis was obtained for mapping the water surface. Divergences can exist, for example, between the dates used to generate reference data (based on the Landsat images) and the water surface annual integrated result, which is not based on a single-year date. There is a great interannual irregularity in the accuracy of practically every biome, pointing to seasonal effects in the water surface that were missed by the reference data. So, the results must be considered as exploratory and preliminary.
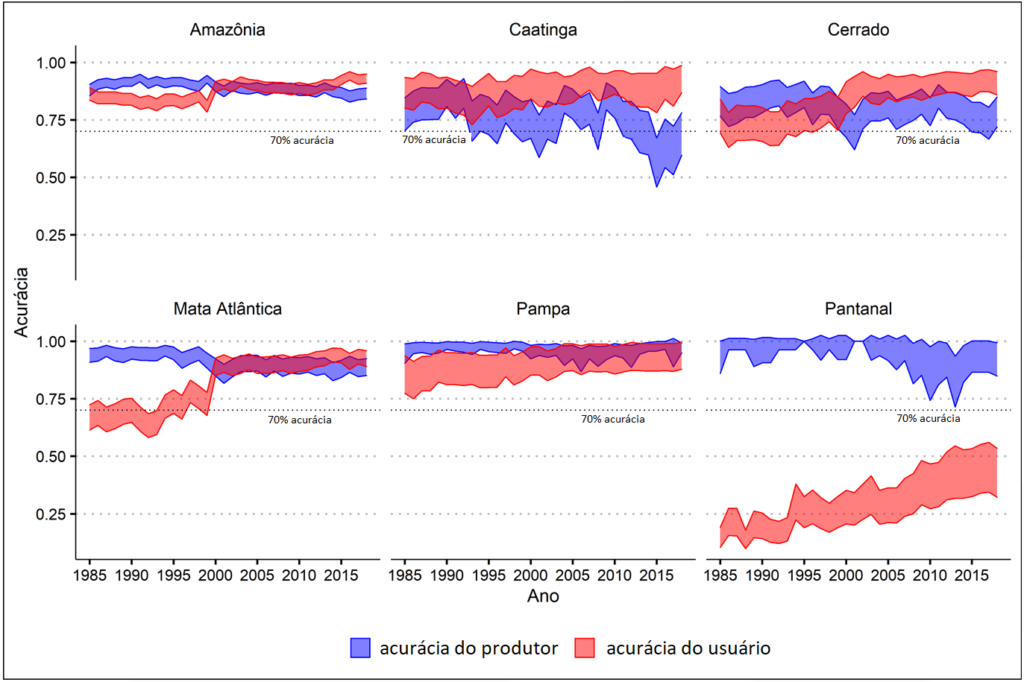
Figure 3. User and producer of “water” class accuracy per biome and year.