

Changes in land cover over the past three decades are exacerbating the risk of desertification in parts of the Caatinga. This is one of the conclusions drawn from the MapBiomas analysis based on satellite imagery of the region between 1985 and 2020. During this period, 112 municipalities in the Caatinga (9%) classified as Areas Susceptible to Desertification (ASD) with Very Serious and Serious status experienced a loss of 0.3 million hectares of native vegetation. This represents about 3% of all native vegetation lost between 1985-2020 in the biome. Of this total, 0.28 million hectares were lost in 45 municipalities in Paraíba classified as ASD.
At the same time, there was a decrease of 8.27% (-79,346 ha) in the surface area of water. Overall, the Caatinga has become drier over the past 36 years. In addition to the reduction in total surface water, there was also a 40% retraction in natural water between 1985 and 2020. This category, which includes freely flowing watercourses, accounted for less than one-third (27.48%) of the Caatinga's surface water in 2020. Most of it was retained in hydroelectric plants (42.69%) or reservoirs (29.61%). In the mapped historical series, the smallest surface water extension (629,483 hectares) was recently recorded in 2017. The average mapped surface water over the 36 years analyzed is 922,000 hectares.
The retraction of the water surface occurred simultaneously with a loss of 10% of natural areas (-5.9 million hectares). All hydrographic regions experienced a reduction in natural vegetation cover between the years 1985-2020. The Northeast Atlantic region had the greatest reduction in terms of area, with a loss of 3 million hectares. In terms of percentage, the East Atlantic region leads the losses with 19.52%, followed by the Northeast Atlantic (-13.40%) and São Francisco (-8.87%). Of the 10 municipalities that lost the most natural vegetation in the Caatinga between 1985 and 2020, eight are located in Bahia.
The loss of primary vegetation between 1985 and 2020 totaled 15 million hectares, or a reduction of 26.36%. Although there was an increase in secondary vegetation of 10.7 million hectares, the overall balance is negative - both in terms of area extent and the quality of vegetation cover. Bahia is the state with the largest area of secondary vegetation: 37,521 square kilometers in 2019.
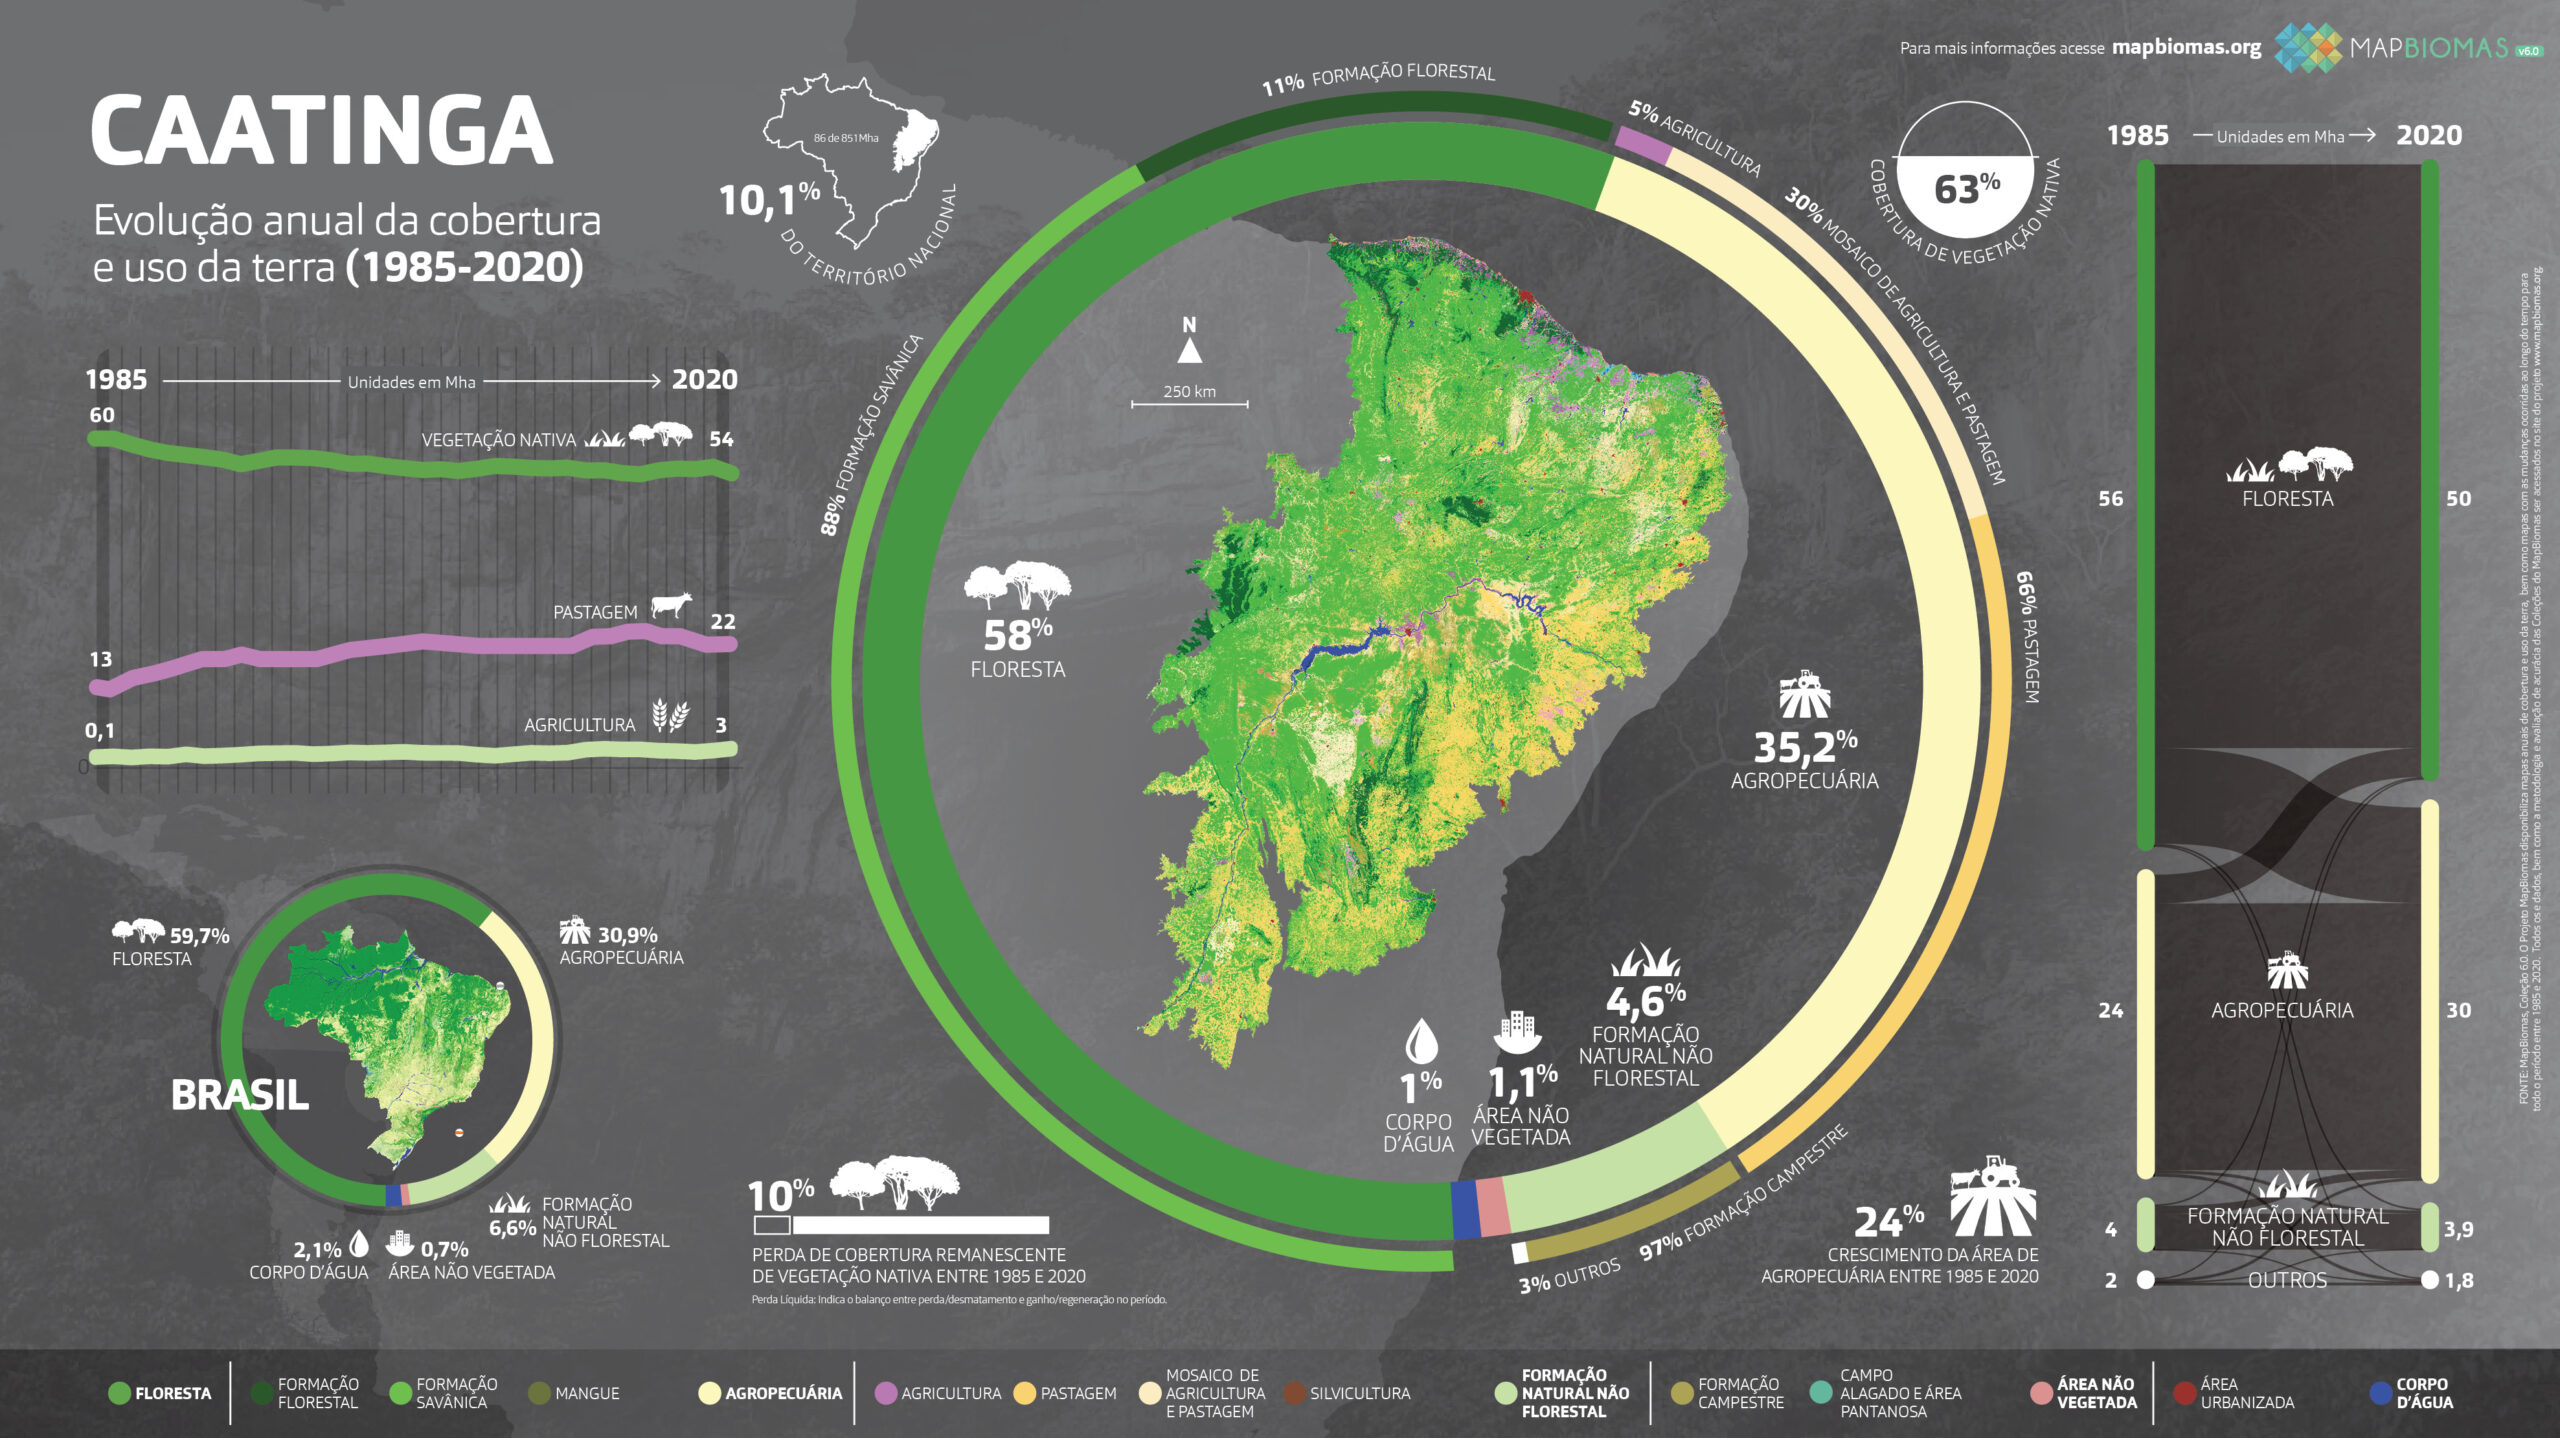
Among the factors causing the loss of native vegetation, the expansion of agricultural and livestock activities stands out. Between 1985 and 2020, over 10 million hectares of savannah and forest formations were converted to agricultural and livestock-related activities. Another 1.26 million hectares of non-forest vegetation were converted for the same purpose during the period. Overall, agriculture and livestock expanded over 11,26 milhões de hectares da Caatinga e passou a responder por 35,2% da área do bioma em 2020. O total de vegetação nativa da Caatinga (ou seja, a soma das áreas ocupadas por savana, campo e floresta) ocupava 63% do bioma, respondendo por 9,8% da vegetação nativa do Brasil.
ABOUT MAPBIOMAS
MapBiomas is a multi-institutional initiative that brings together universities, NGOs, and technology companies that have joined forces to contribute to the understanding of the transformations of the Brazilian territory through annual mapping of land use and land cover in Brazil. In August 2021, MapBiomas Collection 6 was published with maps of land cover and land use in Brazil from 1985 to 2020. The tool developed by MapBiomas for all its initiatives provides information generated with a spatial resolution of 30 meters. The data are processed using automatic classification algorithms through information in the Google Earth Engine cloud. http://mapbiomas.org/
Check out the main highlights of the Caatinga here.
Download the infographics of the biomes..
Learn how the webinar featuring the presentation of Caatinga data went.